You usually see threat attack maps as background images on wall mounted televisions behind a talking head giving an interview to explain the internet is a dangerous place. Some people don’t take these types of displays seriously, usually because people don’t understand their limitations or because people put too much stock in what the simple display is attempting to visualize.
While threat maps can be entertaining, as with all information generated for non-technical people, the data is often too complex to be complete on one display. While a threat map is mostly eye candy with limited context and almost no usable intelligence, there are some very creative ways they can be used to great effect.
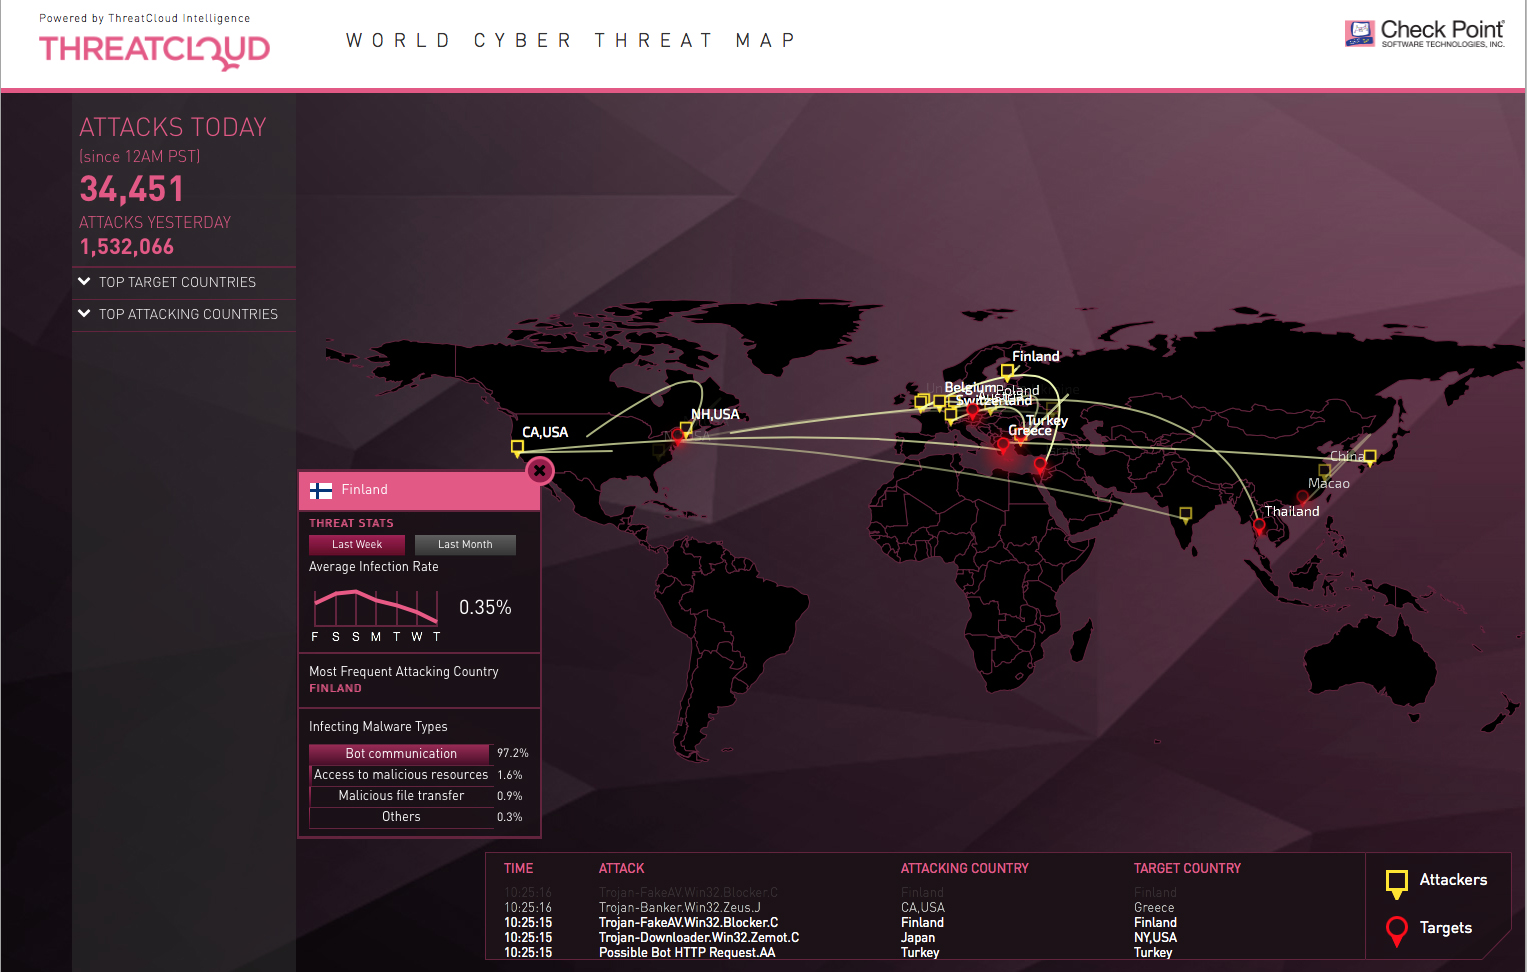
One interesting way to use an animated threat map is in your SOC (Security Operations Center) to provide some context to the the global image of constant attacks and how the SOC is tasked with preventing a successful attack in your business. Many non-technical people don’t understand the volume and intensity of attacks, and this will help them understand the size of the cyber-security problem facing your business today.
The true value of these internet threat maps isn’t specifically the data they’re showing, but how they can be used as a conversation starter.
Bitdefender – There are three main types of attacks visualized on the Bitdefender map: spam, infection, and attacks. This is limited by intelligence gathered by Bitdefender users, but can help illustrate the volume of attacks underway.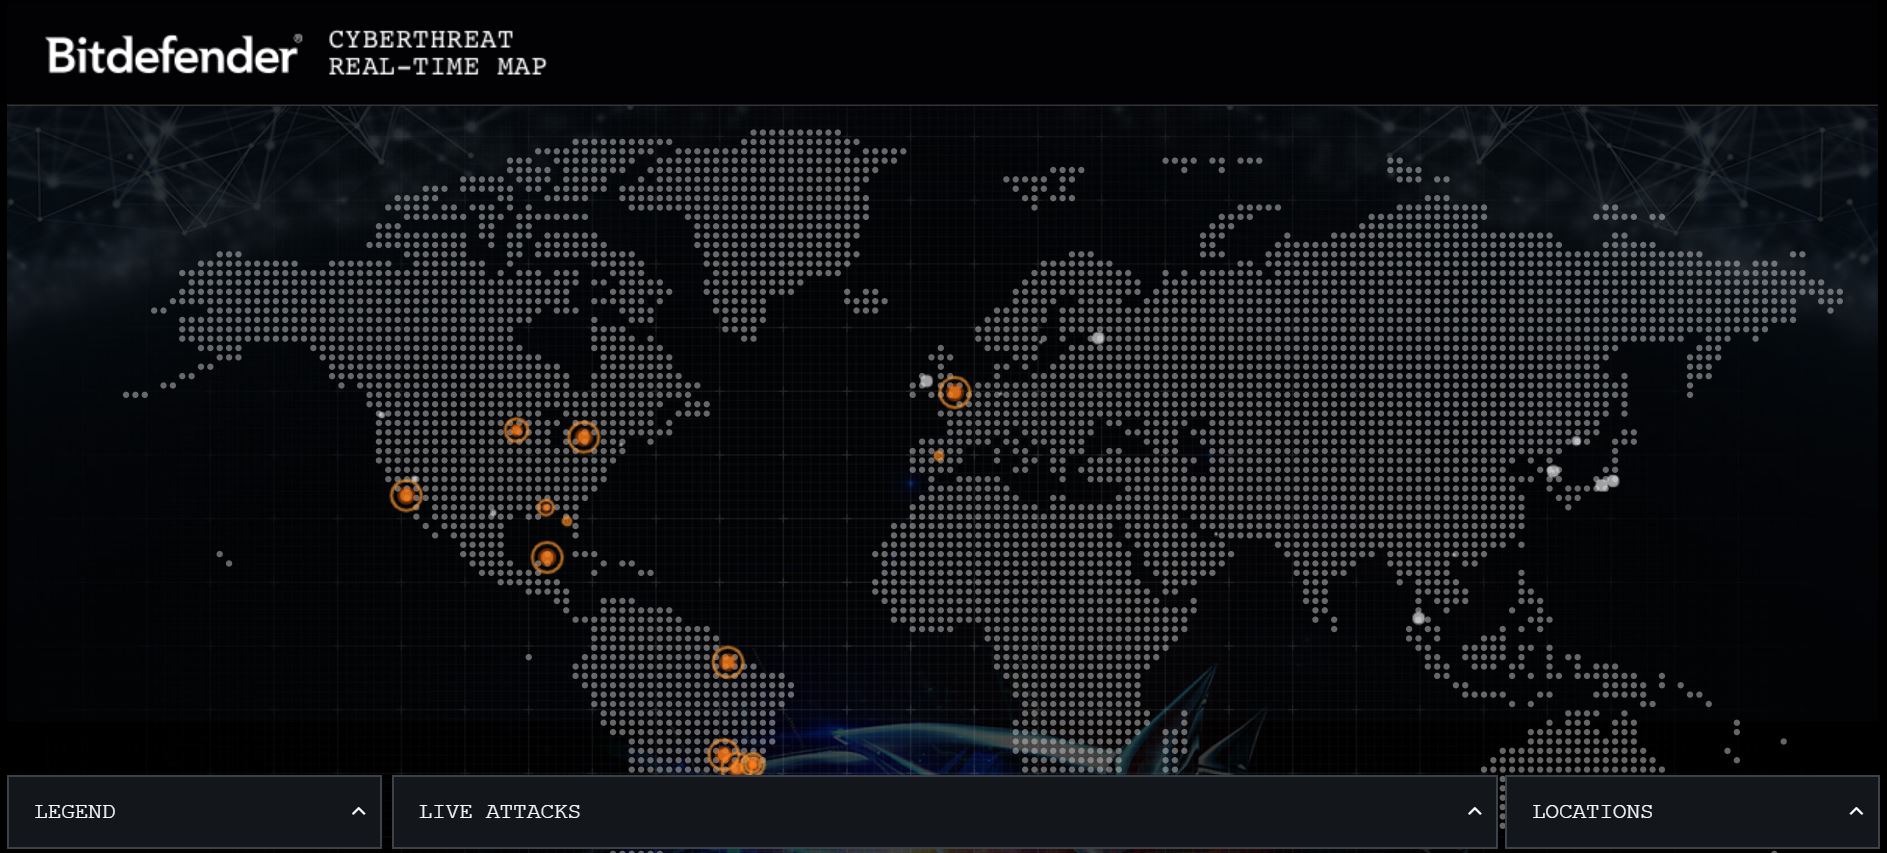


I recommend you become familiar with the tools available to you, so that you can decide if they add any value for your company. If nothing else, you will understand the value of the data presented so you will understand if it means anything the next time you see one on the news.
